Just Transition to Electric Vehicles in Disadvantaged Communities: Integrating Transportation, Energy and Climate Justice
Published in Not published yet, 2024
Electric vehicle (EV) adoption rates show disparities across socioeconomic and ethnic groups, with disproportionately lower adoption rates among low-income communities. These differences may perpetuate existing injustices when electrifying the transportation system. Connections between transportation, energy, and climate justice have been understudied and the existing justice frameworks take siloed views of justice considerations in the EV transition. We conducted semi-structured interviews in four languages with 45 residents of underserved neighborhoods of Columbus, Ohio to investigate how EV adoption intersects with energy poverty, transportation poverty, and climate and environmental injustices. Using reflexive thematic analysis, we propose and apply a novel Just Transition to Electric Vehicles (JTEV) Framework. We identify five main justice themes for transportation, energy, climate, environment, and EV adoption and sub-themes of solar equity gap under the energy justice theme, and five EV subthemes, including barriers to EV adoption, affordable energy support, perceived health and air quality benefits, climate benefits, and economic benefits. We show how intertwined disadvantages perpetuate or exacerbate distributive, recognition, restorative, and procedural injustices in the EV transition. Our findings are important for addressing the vicious cycle of injustices that hinder the capabilities of disadvantaged communities when designing just EV transition policies.

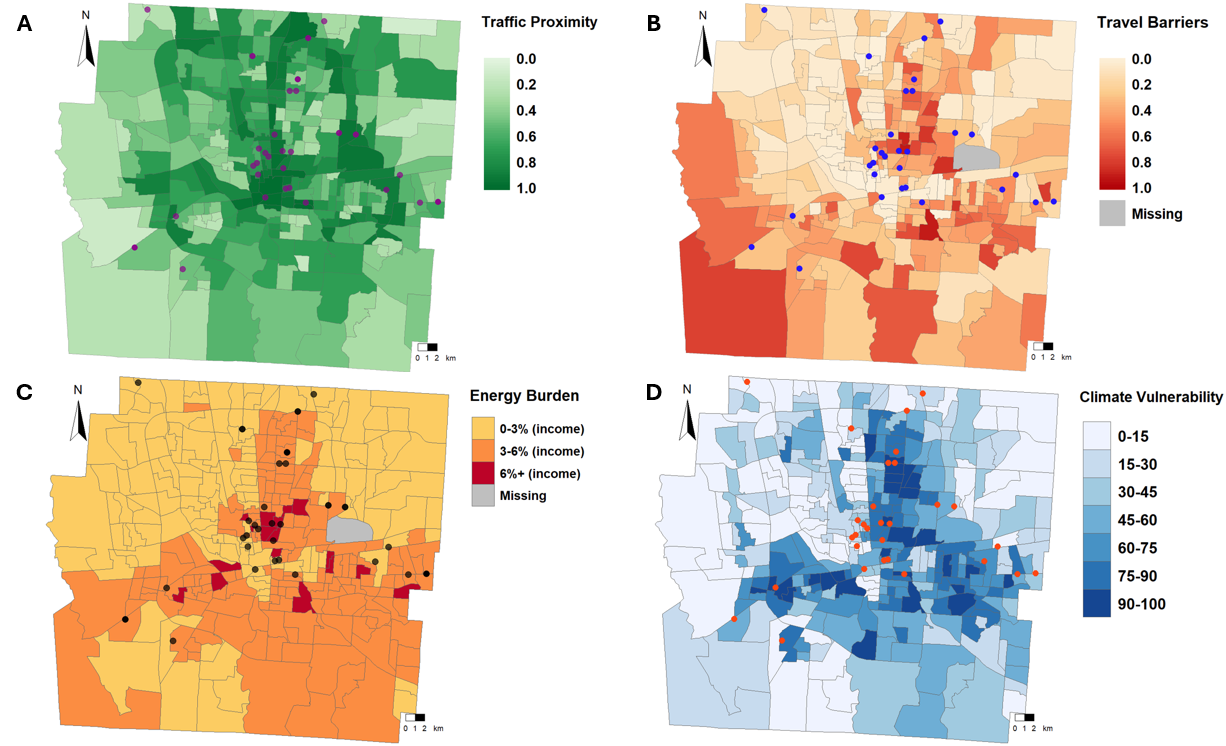
This figure depicts interviewee residential locations in Franklin County by the nearest street intersection (n = 45). I used interviews to test an integrated framework for just transition to electric vehicles. Traffic proximity and volume (percentile) (A), average relative cost and time spent on transportation relative to all other tracts (B), percentage of household income spent on energy costs (C), and susceptibility to disasters from natural or human-caused disasters to disease outbreaks (D). Data from Climate and Economic Justice Screening Tool (A & B), U.S. Department of Energy (C), and U.S. Climate Resilience Toolkit (D).
Recommended citation: (2024). "Manuscript." Not published yet . 1(1).
Download Paper
