Abdirashid Dahir

Research

My research looks at the social side of the energy transition: who can adopt electric vehicles and afford to charge them, how transportation, energy, and climate disadvantages overlap in the same neighborhoods, and how streets, bike networks, and transit reshape cities. I combine interviews and surveys with econometrics, spatial analysis, and agent-based modeling.

Published

Just transition to electric vehicles in disadvantaged communities: Integrating transportation, energy, environmental, and climate justice

DOI PDF
Abstract

Electric vehicle (EV) adoption rates are disproportionately lower in low-income and ethnically minority communities, which may perpetuate injustices when electrifying the transportation system. Existing justice frameworks take siloed views of justice considerations in the transition to EVs, with connections between transportation, energy, and climate justice having been understudied. We developed and applied the novel Just Transition to Electric Vehicles (JTEV) framework, integrating justice considerations in the above domains. We conducted semi-structured interviews in four languages with 45 residents of underserved neighborhoods of Columbus, Ohio (USA) to investigate how EV adoption intersects with energy poverty, transportation poverty, and climate and environmental injustices. The interviews reveal five main justice themes for transportation, energy, climate, environment, and EV adoption and sub-themes of solar equity gap (under the energy justice theme), and five EV adoption subthemes: barriers to EV adoption, affordable energy support, perceived health and air quality benefits, climate benefits, and economic benefits. We showed how intertwined disadvantages perpetuate or exacerbate distributive, recognition, restorative, and procedural injustices in the EV transition. These findings are important for addressing the vicious cycle of injustices that hinder the capabilities of disadvantaged communities when designing policies for a just EV transition.
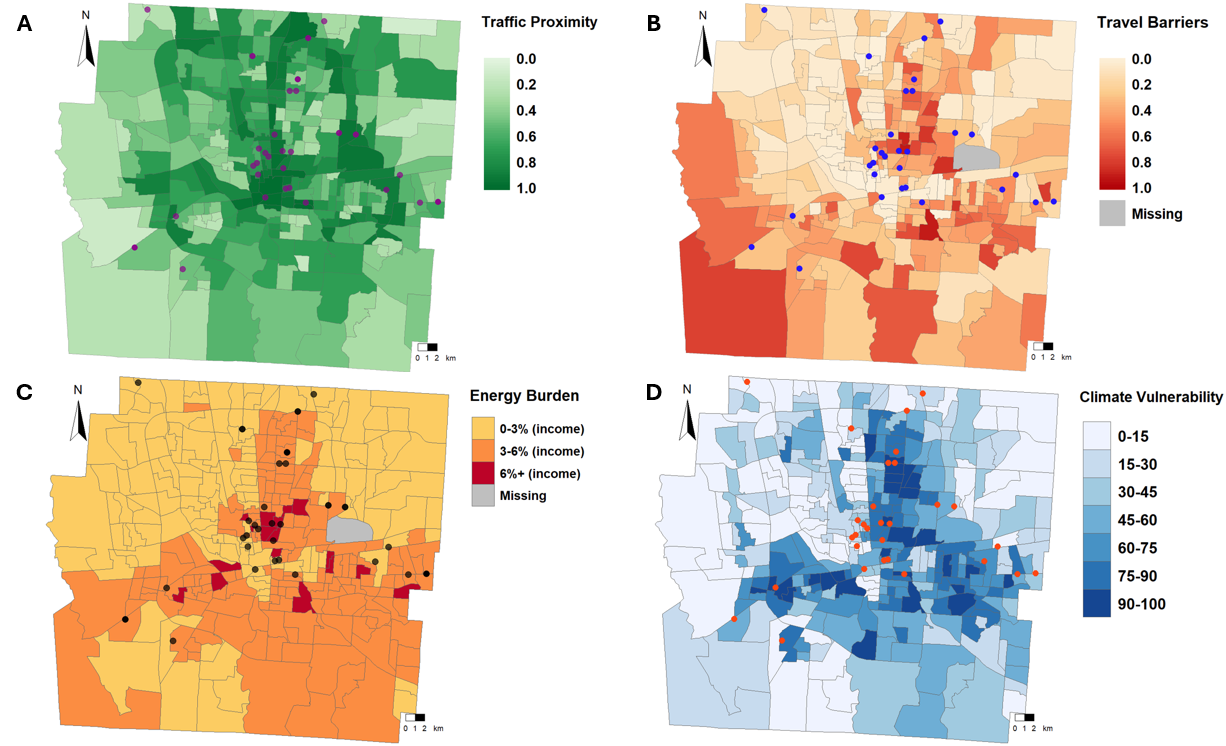
Four maps of Franklin County, Ohio showing interviewee locations against traffic proximity, transportation cost burden, energy cost burden, and disaster susceptibility.
Interviewee locations in Franklin County (n = 45) against traffic proximity (A), transportation cost and time burden (B), household energy cost burden (C), and disaster susceptibility (D).

Impacts of bicycle facilities on residential property values in 11 US cities

DOI PDF TRB talk video
Abstract

Bicycle infrastructure has been found to increase nearby residential property values. However, most evidence for this economic impact is limited to a single city. This study investigates the pre- and post-treatment effects of different types of bicycle facilities on the values of single-family and multifamily homes in 11 cities in the United States from 2000 to 2019. We utilize a quasi-experimental approach with matching techniques and hedonic models to track down the changes in the sales price of residential properties over time within an 800-m buffer of bicycle facilities. We found a mixed impact of property value appreciation, depreciation, and no change in the sales price by different types of bicycle infrastructure including on-street and off-street facilities on single-family and multifamily residential properties across the 11 cities. Single-family and multifamily properties near off-street-only facilities experienced appreciation in Los Angeles, Minneapolis, and Cleveland. Meanwhile, single-family homes near on-street-only facilities tended to decrease their values in Columbus, Eugene, Philadelphia, and Tucson, and increase only in Minneapolis. All properties within 800 m of both on-street and off-street facilities saw their values increase in Columbus and Minneapolis. However, we did not find a statistically significant effect of bicycle infrastructure on housing values in Portland, San Francisco, and Seattle. Findings from our study will inform decision-making and planning for bicycle infrastructure while ensuring the equitable distribution of these facilities and affordable housing for disadvantaged populations.

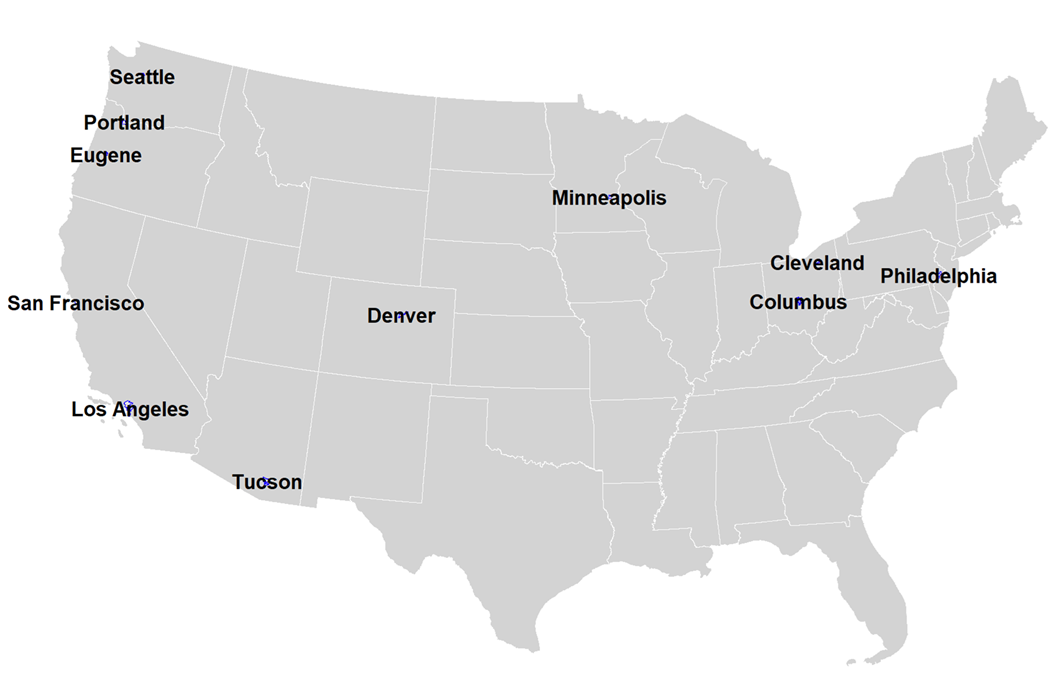
Map of the eleven US cities included in the study.
The eleven US cities in the study.

Under review

Does mood drive movement in daily life? A map-based EMA study

Working papers

Modeling multidimensional barriers to electric vehicle adoption

Modeling inequities in electric vehicle adoption: An agent-based policy assessment

Impacts of bicycle networks on bicycle traffic over time in US cities

How industrial agglomeration and urban fabrics affect travel mode choice over time in Seoul

PDF
Abstract

Past studies on the relationship between the built environment and travel mode choice were conducted with cross-sectional design in the Western context and lack the consideration of industry agglomeration. This study draws upon longitudinal panel data covering 78 districts in the Seoul metropolitan area over four time periods (2002, 2006, 2010, and 2016) to examine the effect of the built environment and industrial agglomeration on travel mode choices using longitudinal multilevel linear regression models. Findings from the present study reveal that changes in travel mode choice can be attributed to changes in the built environment, such as density, urban design, and destination accessibility. Additionally, the heterogeneity of knowledge and manufacturing employment influences travel choices, with intensive clustering of finance, education, real estate, and hospitality jobs moderating car travel demand and facilitating a shift towards transit modes. This study provides evidence for the efforts to rein in car use and promote transit and active travel through pedestrian-oriented and transit-oriented developments in synergy with the metropolitan economic structure in an era of knowledge-based innovation and services in post-industrial cities.

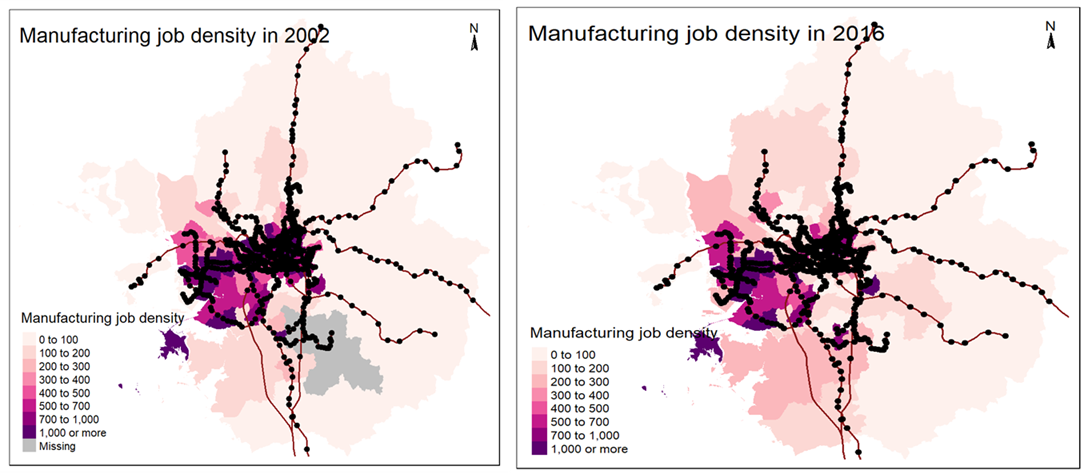
Map of jobs per square kilometre along the Seoul subway network.
Jobs per square kilometre along the Seoul subway network.

Consumer preferences for risk sharing: An application to battery electric vehicles

Reports

Popularizing electric vehicles: How can we make EVs the car of choice for consumers?

Road accident severity classification using the US Accidents dataset

PDF
Summary

Using 1.5 million US accident records, I predicted accident-induced congestion severity with random forests (bootstrap aggregation) and one-vs-one and one-vs-rest support vector machines after feature selection with correlation coefficients and mutual information. Random forests outperformed both a logistic regression baseline and the SVMs on overall accuracy and confusion-matrix metrics. The results also show that accident-induced congestion was less severe during the COVID-19 pandemic than before it.

Innovative street design approaches in urban areas to end automobile dependence